Field Technician Scoreboard
The Technician Scoreboard is all about measuring a Field Service or Installation Technician’s (or any billable employee) performance. We have included every major key performance indicator and ratio that is taught by the EGIA Contractor University and James R. Leichter.
The Scoreboard takes advantage of the enterprise level accounting and bookkeeping system built into Total Office Manager. Because of our true “all-in-one” software advantage, it contains more specific and accurate information about technicians than anything else we have ever seen. You will need to be using the software to its near fullest extent to get the most out of Contractor Compass. There are links to other related topics at the bottom on this page.
You Must Setup and Use Total Office Manager Properly
We have all heard the old saying “garbage in, garbage out”. You must be using Total Office Manager to its fullest potential. This includes using work orders, timesheets, invoices, estimates, sales opportunities, marketing sources, departments, and much more. You must also assign work orders to invoices and estimates.
There are many important fields on forms that are essential to Contractor Compass and the Scoreboard. Many forms in Total Office Manager include a selection box called “What Best Describes This”. The value of this field is very important to this workbook (Scoreboard). Our help topics include information on where to find most or all of these. See Related Help Topics at the bottom of this page.
Preparing to use the Technician Scoreboard
Please be sure to read and follow the help topic on preparing for Contractor Compass®. The same conditions and requirements apply. A link to that topic is at the bottom of this help topic.
Minimum Microsoft Excel Versions Required
You must be using Excel 365 or Excel 2021 (32-bit or 64-bit). We use the FILTER function in many of our workbooks. The FILTER function is only available in Excel for Microsoft 365 and Excel 2021. In Excel 2019, Excel 2016 and earlier versions, it is not supported.
Using the Technician Scoreboard
Using this technician scoreboard is super easy.
- Open the Contractor Compass application in Windows.
- You may need to select a Company File and enter some connection related information. This is typically only required when using the app for the first time. You can switch between multiple companies.
- Select a username and password and click the Login button. This is the same username and password you use to log into Aptora’s Total Office Manager.
- Click View Dashboards. Note: This can be single or double clicked. It doesn’t matter which.
- Under the Company Dashboards windows, double click Technician Scoreboard.
- Wait for the Excel file to open. This process can take thirty seconds to several minutes, if you have a lot of data to process.
- You may filter the results using the Department filter or Date Range filter. Technicians are ranked by Gross Profit per Person Day (the column header is GP$ per Person Day). You may select a different way of ranking technicians using the Rank Technicians On selection.
- Click the Refresh button (top left) to reload data from your Company File (if needed or desired).
Reload and Refresh Dashboard Data
There is a Refresh button to the left of the “Last Updated” label (top left). That will refresh the information without opening and closing the workbook from Contractor Compass.
Automatic Reload and Refresh
The Technician Scoreboard automatically reloads from Total Office Manager and refreshes every thirty minutes. This makes it easier to display the Technician Scoreboard on a TV or large monitor. The results will auto update without user intervention. The “Last Updated” label will let viewers know how fresh the results are.
Presentation Mode
When the Excel file opens from Contractor Compass, it will be in Presentation Mode. This mode hides things that the user would not normally wish to see or have access to. At the top of the Scoreboard worksheet, there is a button to place the Excel file into what we call Normal Mode. Doing so unhides the things that the application was hiding. You may click the button to go back to Presentation Mode.
Using Filters
When filters are used or the worksheet is otherwise changed, it automatically recalculates the numbers on the Scoreboard. When the worksheet recalculates, it automatically goes back to Presentation Mode.
Always Open from Contractor Compass®
The Excel file must be launched from the Contractor Compass app to function properly. This is the only way the file can receive information from Total Office Manager. If you open the file directly, it is not possible to connect to your Total Office Manager database.
Understanding the Scoreboard Information
Popup Notes on Columns
When you see a red triangle at the top right of a cell, that cell contains a Note. Hover over that cell and the note should display. It will help explain what the field means and where the information comes from.
Frequently Asked Question about the Scoreboard
Q: When I manually add up all the numbers reported on the dashboard and compare them to reports in Total Office Manager, they do not agree. Why?
A: That is highly likely. The reports you are looking likely follow different rules and have different purposes. GAAP compliant financial reports follow different rules than employee dashboards might. When there are two or more employees involved in a record or transaction, we often do a lot of extrapolating and allocating, in order to assign data to each employee. There are other challenges such as how to allocate discounts and adjustments.
- We do not look at adjusting journal entries, item adjustments, or payroll adjustments.
- The dates of records and transactions may also cause differences or anomalies. Example: You may have a work order dated March 31 that was used to create one or more invoices dated inside the following month.
- A Work order can be assigned to two or more invoices. While should (almost) never be done, it will cause your percentages of labor and revenue to be incorrect.
- Be sure that all of the involved employees are checked as “Billable” in their Payroll Item Setup form.
- Verify that you have the correct number of Person Days in each employee’s Payroll Items Setup. This value is displayed in column Q, on the Scoreboard. That column is hidden by default.
Q: Why do some of the Scoreboard columns have a light red boarder around them?
The red boarders indicate that the number is a key number. In addition to the Technician’s rank, there are four other numbers that we consider to be the most important: GP$ per Person Day, Labor to Sales Ratio, SAs Sold, and Sales Leads Created.
Q: Why do I see a technician called “UnAssigned” on the Scoreboard?
A: That indicates that one or more records in Total Office Manager did not have a technician assigned to them. Examples could include invoices, sales opportunities, and many others. To fix this, please read the help topics related to preparing for Contractor Compass.
Q: If two or more technicians are on an invoice, how is the invoice divided out among those technicians?
A: It is proportionate to each technician’s timesheet hours. If there was a total of three hours paid for that invoice and one technician had one hour, they will get credit for 33.33% of the invoice. We use the Assign Work Orders feature found on the Invoice extensively.
Q: Why do some numbers use a decimal point when that number always has zeros at the end? Example: Number of Callbacks = 4.00.
A: That is done when the number has the potential of being less that one. Callbacks could be 4.50 or 4.75. There are times when a value can be shared amount two or more employees. Consider the NFL when a player can be credited with 2.5 QB sacks.
Q: We have certain information that seems to be missing or is correct. How do we resolve this?
A: This is usually the result of setup and or usage of Total Office Manager®. Be sure to read the Preparing Total Office Manager for Contractor Compass help topic. You must be using Total Office Manager to its fullest potential. That means using almost all the features.
Q: When I click on a cell in the Scoreboard sheet, I do not see a formula. Why?
A: Please see “How Formulas are Used” below for complete information.
Q: How is invoice income allocated to technicians where multiple technicians were involved, each having different time sheet hours?
A: Work orders are created and there is one technician per work order. Invoices are created from those work orders, so invoices are directly associated with work orders. Since work orders must have a technician (employee) on them, we are able to associate technicians with invoices. Technicians enter their timesheet hours from the work order. Time sheets track the number of hours a technician was paid for the invoice. We use this information to allocate an amount of income to each technician proportionate to the percent of their hours compared to the total number of technician hours (TechHours) paid for the entire invoice.
Example:
Invoice Subtotal: $1000.00
Total Hours from Time Sheet: 8
Bob: 5 Hours (62.5% of the total hours)
John: 1 Hour (12.5% of the total hours)
Eddy: 2 Hours (25% of the total hours)
Allocation of Income (column: AllocationOfIncome)
Bob: $625.00
John: $120.00
Eddy: $250.00
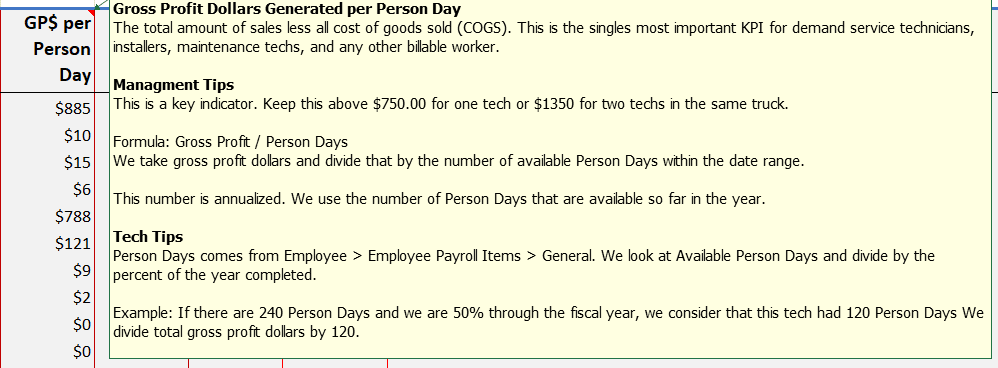
Q: How is Gross Profit Per Person Day Calculated?
A: Gross profit is annualized and we consider how many Person Days have been used during the fiscal year. In version 2.20, we updated the formula (in column D) to report GP/PersonDays/YearFrac(StartDate-1,EndDate). We are now using the YearFrac function. It will accommodate any date span. If you show two years on the dashboard, the YearFrac will cause the final value to be multiplied by 2 (which is what is needed, because the Gross Profit will be for 2 years). Similarly, if the data runs from 1/1 to 2/13, then it will divide by (approx.) 0.12 . . . or essentially multiplying the gross profit by 8. This improves the accuracy of the data and makes the calculation far more reliable. Person Days are entered in each employee’s Payroll Setup.
Tips
- If a number is #.#, then there is a possibility of a fraction. If a number is whole, then there is no possibility of a fraction. Percentages are all formatted as #.##% for consistency. Cents have been omitted from all dollar amounts.
- The Date Range selectors include the oldest and newest dates from the data available. If the date you want is not available, that date does not exists in the Dept-Info worksheet.
- When the workbook refreshes, it will always go back to Presentation View.
- The scoreboard reloads and refreshes automatically every thirty minutes or when you click the manual refresh icon.
- 200 Employee Limitation: The Scoreboard worksheet display can handle up to 200 employees. If you have more than 200, please let us know.
- You must assign work order to Invoices and Estimates. That means you will either create invoices and estimates from work orders or use the Assign Work Orders feature that is found under the Invoice or Estimate Menu button.
- You must use the Timesheets feature for the technicians on the work orders.
- Invoices have a field called Labor Minutes. When checking the accuracy of the dashboard, be sure to pay attention to this number. Remember that Group item types allow the Labor Minutes to be overridden.
- The workbook will only populate when it is opened from Contractor Compass. When you open the workbooks directly from Excel, you will see information that was added the last time it was opened from Contractor Compass.
- There is a Refresh button located near the logo (top left). This will refresh the dashboard data without the need to close and reopen it.
Known Issues
- Clipboard Error: You may receive a message wording something like this: We couldn’t copy the content to the clipboard because it’s in use by another application. You can still paste your content within this workbook, but it won’t be available in other applications. This issue is something that is common with Excel and should not be affecting the performance of the program. The workbook is using the Windows clipboard to paste information from one worksheet to another.
- Multiday/Multitech work orders can cause major challenges when dividing out invoice data amount two or more employees. The numbers may not add up to match the actual invoice totals or counts but the proportions should be substantially correct. It is best practice to use one work order per technicians.
- We were forced to use Comments instead of Notes due to formatting problems the Notes feature was causing. We believe that Notes look better, so we will continue to work on this issue.
- The dropdown menus in Excel typically do not work with a mouse scroll wheel. This appears to be an issue with Excel that we cannot control.
- Avoid using muti-day multi-tech work orders. Multiday/Multi-Tech work orders can cause major challenges when dividing out invoice data amount two or more employees. The numbers may not add up to match the actual invoice totals or counts but the proportions should be substantially correct. It is best practice to use one work order per technicians.
Editing the Excel Workbook
Please be careful editing the worksheet (Excel file), work on copies, and always make backups.
The Excel file is 100% editable and customizable. That allows users to make both major and minor changes. Please do not edit any of the worksheets unless you are competent and comfortable doing that type of work. If you wish to modify the workbook, always work from a copy. Please see Related Help Topics below, if you would like to know more about how to edit a workbook.
You will need a password to edit any of the worksheets. That password is included in a worksheet called Help. If you change the password, the workbook may no longer function. Aptora will not be able to tell you what your new password is and we can’t reset it for you.
No Support for Excel or VBA
Aptora provides no support or advice about working in Microsoft Excel® or modifying the workbook.
How the Scoreboard is Populated
Contractor Compass® loads the Dept-Info tab when it launches Excel and opens the workbook file. The Scoreboard gets all of its information from the Dept-Info worksheet.
The Dept-Info worksheet will only populate when it is opened from Contractor Compass®. When you open the workbooks directly from Excel, you will see information that was added the last time it was opened from Contractor Compass. There is a Refresh button that will refresh the information without opening and closing the workbook from Contractor Compass.
This article includes additional advanced information on this topic and more, further down this page.
Related Help Topics
Preparing Total Office Manager for Contractor Compass™
https://www.aptora.com/help/preparing-total-office-manager-for-contractor-compass/
How to Install and Use Contractor Compass
https://www.aptora.com/help/how-to-install-and-use-contractor-compass/
Financial Ratios. Their Meaning and Usage.
https://www.aptora.com/tips/financial-ratios-their-meaning-and-usage/
Scoreboard Workbook Structure and Operation (advanced info)
Intended Audience
The following information is for those users that wish to know more about how this Excel was built and how it operates. This information will be helpful only to those wishing to make changes or modifications to the workbook. Most users will never need to know any of this.
How it Works
The Contractor Compass Technician Scoreboard is a Microsoft Excel® Workbook. Excel refers to each tab as a Worksheet. The entire Excel file is called a Workbook. When this workbook is opened from the Contractor Compass® app, a connection is made to your Total Office Manager® database. Once connected, code inside the workbook is ran. This code is known as Visual Basic for Applications (VBA). VBA is also used to create Macros. The code calls (runs) queries contained in the Total Office Manager database and that information is added to the Dept-Info tab. Information in the Dept-Info tab is deleted prior to being repopulated.
The VBA code can be viewed and edited from the Developer tab in Excel. The Dept-Info worksheet (tab) is where most of the Scoreboard information is located. The Dept-Info worksheet (tab) contains raw data. It can be helpful to examine this worksheet to help you determine why certain information is not being included.
The Lists worksheet contains information necessary for the Department, Date, and Ranking filters (in the Scoreboard worksheet) to function. This information is dynamically generated and should not be modified.
The Scoreboard worksheet is where the information is displayed. All other worksheets are for gathering and organizing the information.
How Formulas are Used
The formulas used to populate the Scoreboard Technician information will be found on row 500 of the Scoreboard sheet. When the Scoreboard worksheet is calculated, the formulas in row 500 are copied to each row that represents a technician, as long as that row includes a name in the Technician cell.
The formulas calculate the numbers, and those numbers are added to each cell in that row. After that process has completed, the formulas are deleted and only the value remains. This process is known as “Formulas_Copy”. All empty rows are then hidden using VBA code.
Viewing the Scoreboard Formulas
All empty rows (rows with no technicians) are hidden. To view them, click Review, Unprotect Sheet, and enter the password found in the Help worksheet. From the Scoreboard sheet, click the upper righthand corner of the rows (grid) to highlight the entire sheet, right click, and select Unhide.
Please Note: The rows will be rehidden and the entire workbook will be password protected each time it is refreshed or opened.
Miscellaneous Information
- The dropdown selection boxes (dropdown menus) may have an image on an arrow where the arrow on the selection would normally be. That’s because Excel does not show that arrow unless the selector is clicked. The image helps users realize that the box is a selection box.
- We used Comments rather than Notes to display popup information. When the workbook was created, there were known bugs with Excel that created problems when we used Notes.
Dept-Data Worksheet – Column Definitions
This section explains what information is found in each of the columns within the Dept-Info worksheet. They are presented in the same order, from left to right, as the worksheet.
Key Points to Remember
- All data is returned for YTD & Last Year. This is based on your Fiscal Year. Company Information > Fiscal Year.
- We are only including data for Billable Employees. This is a setting in Employee > Payroll Items Setup > Billable checkbox.
- The data in this worksheet is only as good as the way the software was set up and being used. It is important to go through the Preparing Total Office Manager® for Contractor Compass™ help topic.
Explaining the Scoreboard Columns
Demand Service to Serv Agrmnt Conv:
The number of demand service work orders that resulting in the sale of a service agreement. The SA must be on an invoice that is assigned to the work order. Be sure your work order types are using the “What Best Describes This” setting.
No. of Invoices: Count the number of sales by Technician. Sales and Invoices will both be counted. It is looking at techs assigned to the invoice from the Work Order Assignment form. This number can be a fraction. If there are two techs assigned, they may each get credit for 0.5 invoices. If the employee was on a work order associated with an invoice, that is counted. The number of invoices for each tech may be greater than the total number of invoices for the company. When two techs are on one invoice, they each get credited for one invoice.
Other Leads DemandService-Prev Maint: The number (quantity) of sales leads created while doing planned maintenance work. A sales lead must be created.
Prev Maint to Service Agrnt Conv: The number of planned maintenance work orders that resulted in the sale of a service agreement. The SA must be on an invoice that is assigned to the work order. Be sure your work order types are using the “What Best Describes This” setting.
SA Expiring this Year: The total number (quantity) of all service agreements that have an expiration date within the current fiscal year.
Sales Leads Created: The total number (quantity) of all sales leads created YTD. Sales leads are created from the Sales Opportunity Manager.
Sales Leads from Demand Service: The number of sales leads (in SOM that were created while doing Demand Service. This calculation depends on you using the Department features extensively and the “What Best Describes This. . .” setting found in many forms.
SO Equip Leads: The number of (quantity) of all sales leads where some type of equipment was the selected product. The Product must have the correct What Best Describes value set.
SO Equip Leads Value: The dollar value of all sales leads where some type of equipment was the selected product, in currency format. The Product must have the correct What Best Describes value set.
SO IAQAWT Leads: The number (quantity) of all sales leads where IAQ, Accessories, or Water Treatment was the selected product. The Product must have the correct What Best Describes value set.
SO IAQAWT Leads Value: The dollar value of all sales leads where IAQ, Accessories, or Water Treatment was the selected product, in currency format. The Product must have the correct What Best Describes value set.
SOM Equip Leads: The number of sales leads that were created and had a Product Type of Equipment. The “What Best Described This Product” value must be set to any of the equipment types.
SOM IAQ Leads: The number of sales leads that were created and had a Product Type of IAQ or Accessories. The “What Best Described This Product” value must be set to any of the IAQ or accessory types.
SOM Leads: The total number of sales leads of any type, product, or circumstances. This value looks at Employee Leads.
SOM Other Leads: The total number of sales leads based on criteria other than the other listed SOM leads (all other sales leads).
WO Callbacks: The number of work orders that are classified as Callbacks. Be sure that you are using the work order Callback feature. Check your Work Order Types and make sure you are setting a What Best Describes this WO Type value.
WO Warranty: The number of work orders that are classified as Warranty. Be sure that you are using the work order Warranty feature. Check your Work Order Types and make sure you are setting a What Best Describes this WO Type value.
Man Days: This column is hidden by default. It displays the value from the employee’s “Available Person Days” field in that employee’s Payroll Setup form.
Unassigned: You may see this term used in place of an employee name. This result is caused from the inability to associate a technician with an invoice or other transaction. This may occur for several reasons. The most common is when an invoice does have a work order associated with it or that the technician is not marked as “Billable” in their Payroll Items Setup.
Explaining the Source Data
The following includes definitions and information about the columns of information found in the “Dept-Info” sheet. This sheet is hidden by default.
CntType: There are many different CntTypes that are included in the Dept-Info worksheet. This offers users a huge amount of very useful business information to build things with. Here is a list of definitions for each one of them. All data is returned for YTD & Last Year. This is based on your Fiscal Year. Company Information > Fiscal Year. We are only including data for Billable Employees. This is a setting in Employee > Payroll Items Setup > Billable checkbox.
CntValue: The number of occurrences, during the same CntValue, for a given transaction of other data. This number can be a fraction. The technician may be getting credit for part of a transaction. He/she may have been one of two or more technicians assigned to an invoice. The technician’s timesheet hours (wt.TSHours) divided by the total invoice hours (InvHours), rounded to four decimal places. If the total invoice hours (InvHours) is zero, CntValue is 0.
CntMonth: The fiscal month that included the CntValue. Format = ##. The month is expressed as a number from 1 to 12. 1 is January and 12 is December.
CntYear: The fiscal year for the transaction or other data. Format = YYYY
Department: The name of the Department as set up in Total Office Manager. Departments with the same name will have their data combined. This value is what is used in the Department selection list.
Industry: The name that was selected from the Industry list in Total Office Manager. Each department has this selection list. This is not a required field, but it is recommended to select a value.
Division: The name selected from the Division list in Total Office Manager. Each department has this selection list. This is not a required field, but it is recommended to select a value.
DeptType: The name selected in the Type list in Total Office Manager. Each department has this selection list. This is not a required field, but it is recommended to select a value.
Tech-Last-First: The last and first name of the employee as found in the Edit Employee form.
Technician: The “Print Check As” field of the employee as found in the Edit Employee form.
TechAlias: The value of the Alias field found in the Edit Employee form (in Total Office Manager). This is a unique and required field.
TranDate: The full date of the transaction or the entry date of the record. Format = YYYY/MM/DD. This date is then converted to the last day of that month. Example: 2022-07-05 becomes 2022-07-31. We then combine all the same transactions within that month into one row. This helps reduce the number of rows. Otherwise, there would often be too much information (rows) to add to this sheet. Excel has limits that we could easily exceed.
TranSubtotal: The total amount of the transaction before sales tax.
TranTax: Sales tax applied to the transaction.
TranTotal: The subtotal plus sales tax.
TranBalance: The unpaid portion of TranTotal. This is what your customer still owes you.
TechHours: The number of hours entered on a timesheet by employee. Be sure you are including the work order that was assigned to the invoice.
BilledHours: The number of hours sold on the invoice. Be sure that you are using the Item’s Labor Minutes feature and assigning work orders to invoices. The number of minutes of labor on the invoice. This comes from a Service item. It must have a correct value in the “Labor Minutes” field and the “Labor Only (used for labor only) box must be checked in the Accounting tab. It is calculated by dividing the summed labor minutes by 60.
TechLabor: The tech’s hourly rate plus payroll liability items (payroll taxes).
COGS-NonLabor: The amount of all non-labor related income on the invoice in currency format. Sales tax is never considered.
Discount$: The total amount of any discounts on the invoice. It looks at Discount Items. Sales tax is never considered.
SADiscount$: The total amount of any discounts, only related to a service agreement, was included on the invoice. It looks at discount items that were created when the SA was created. These are special item types not created by the user. Sales tax is never considered.
SASold: The quantity of Service Agreement Item types that were included on the invoice.
SASold$: Sales tax is never considered.
DiagOnly?: A count of invoices where the only thing included on it was a Diagnostic Fee item. Be sure to set the item up as a Diagnostic Fee. We count all invoices and sales for this tech that only have a diagnostic fee item and nothing else. We do not count these when the amount of the invoice is equal to zero. Those are counted as Zero Amount Invoices.
DiagOnly$: The dollar amount of Diagnostic Fee only invoices in currency format. Sales tax is never considered.
IAQ-Acc Sold: The total quantity of IAQ related items found on invoices.
IAQ-Acc Sold$: The dollar amount of IAQ related items found on invoices in currency format. Be sure that your invoice item Is setup properly. Sales tax is never considered.
EquipSold: The total quantity of equipment related items found on invoices. This value comes from serialized item types.
EquipSold$: The dollar amount of equipment related items found on invoices in currency format. This value comes from serialized item types. Be sure that your invoice item is set up properly. Sales tax is never considered.
PercOfHours: Total Paid Hours on an Invoice / Total Paid Hours for the Tech on that Invoice. This is calculated from the total Hours on the Timesheet where the Work Order is assigned to the Invoice.
PercOfIncome: The percentage of the income based on hours assigned. If two techs and one worked 3 hours and one worked 2 hours, one gets 2/5 of income the other gets 3/5. We take percentage of hours (or CntValue) and multiple by TranTotal. It is expressed as currency.
AllocationOfIncome: The subtotal (no sales tax) amount of income (aka: revenue or sales) from an invoice (also includes sales and credits) that is allocated to the technician. It is based on the number of time sheet hours they had for that invoices compared to the total number of hours for that invoice. It is designed to allocate the invoice’s revenue based on the technician’s share of hours but using the invoice subtotal (which is the invoice total minus tax, plus any payments).
AllocationOfTechHours: The percentage of each technician’s labor hours (TechHours) compared to the total labor hours (TechHours) for the invoice. TechHours are time sheet hours, not hours sold on the invoice.
TechHoursTotal: The total number of hours appearing on all time sheets for a given transaction (invoice).
ManDays: This comes from Employee > Payroll Items Setup > Person Days. This is the number of billable days this employee has available annually.
TechID: A unique number that is automatically assigned to the employee by the database when it is entered through the software program. This cannot be changed by a user.
FiscalMonth: The month of the transaction or record creation date. Format = ##. The month is expressed as a number from 1 to 12. 1 is January and 12 is December.
FiscalStart: The beginning date of the company’s fiscal year. Format = YYYY/MM/DD. This information comes from the Company Information form in Total Office Manager.
FiscalEnd: The ending date of the company’s fiscal year. Format = YYYY/MM/DD. This information comes from the Company Information form in Total Office Manager.